MySuper dashboards
You can use the dashboards to help you compare our MySuper products with other super funds' MySuper products.
Vision Super MySuper product (Vision MySuper)
Active Super MySuper product (Active Super MySuper)
If you’re looking for more information to help you choose the right MySuper fund for you, ASIC’s MoneySmart website can help.
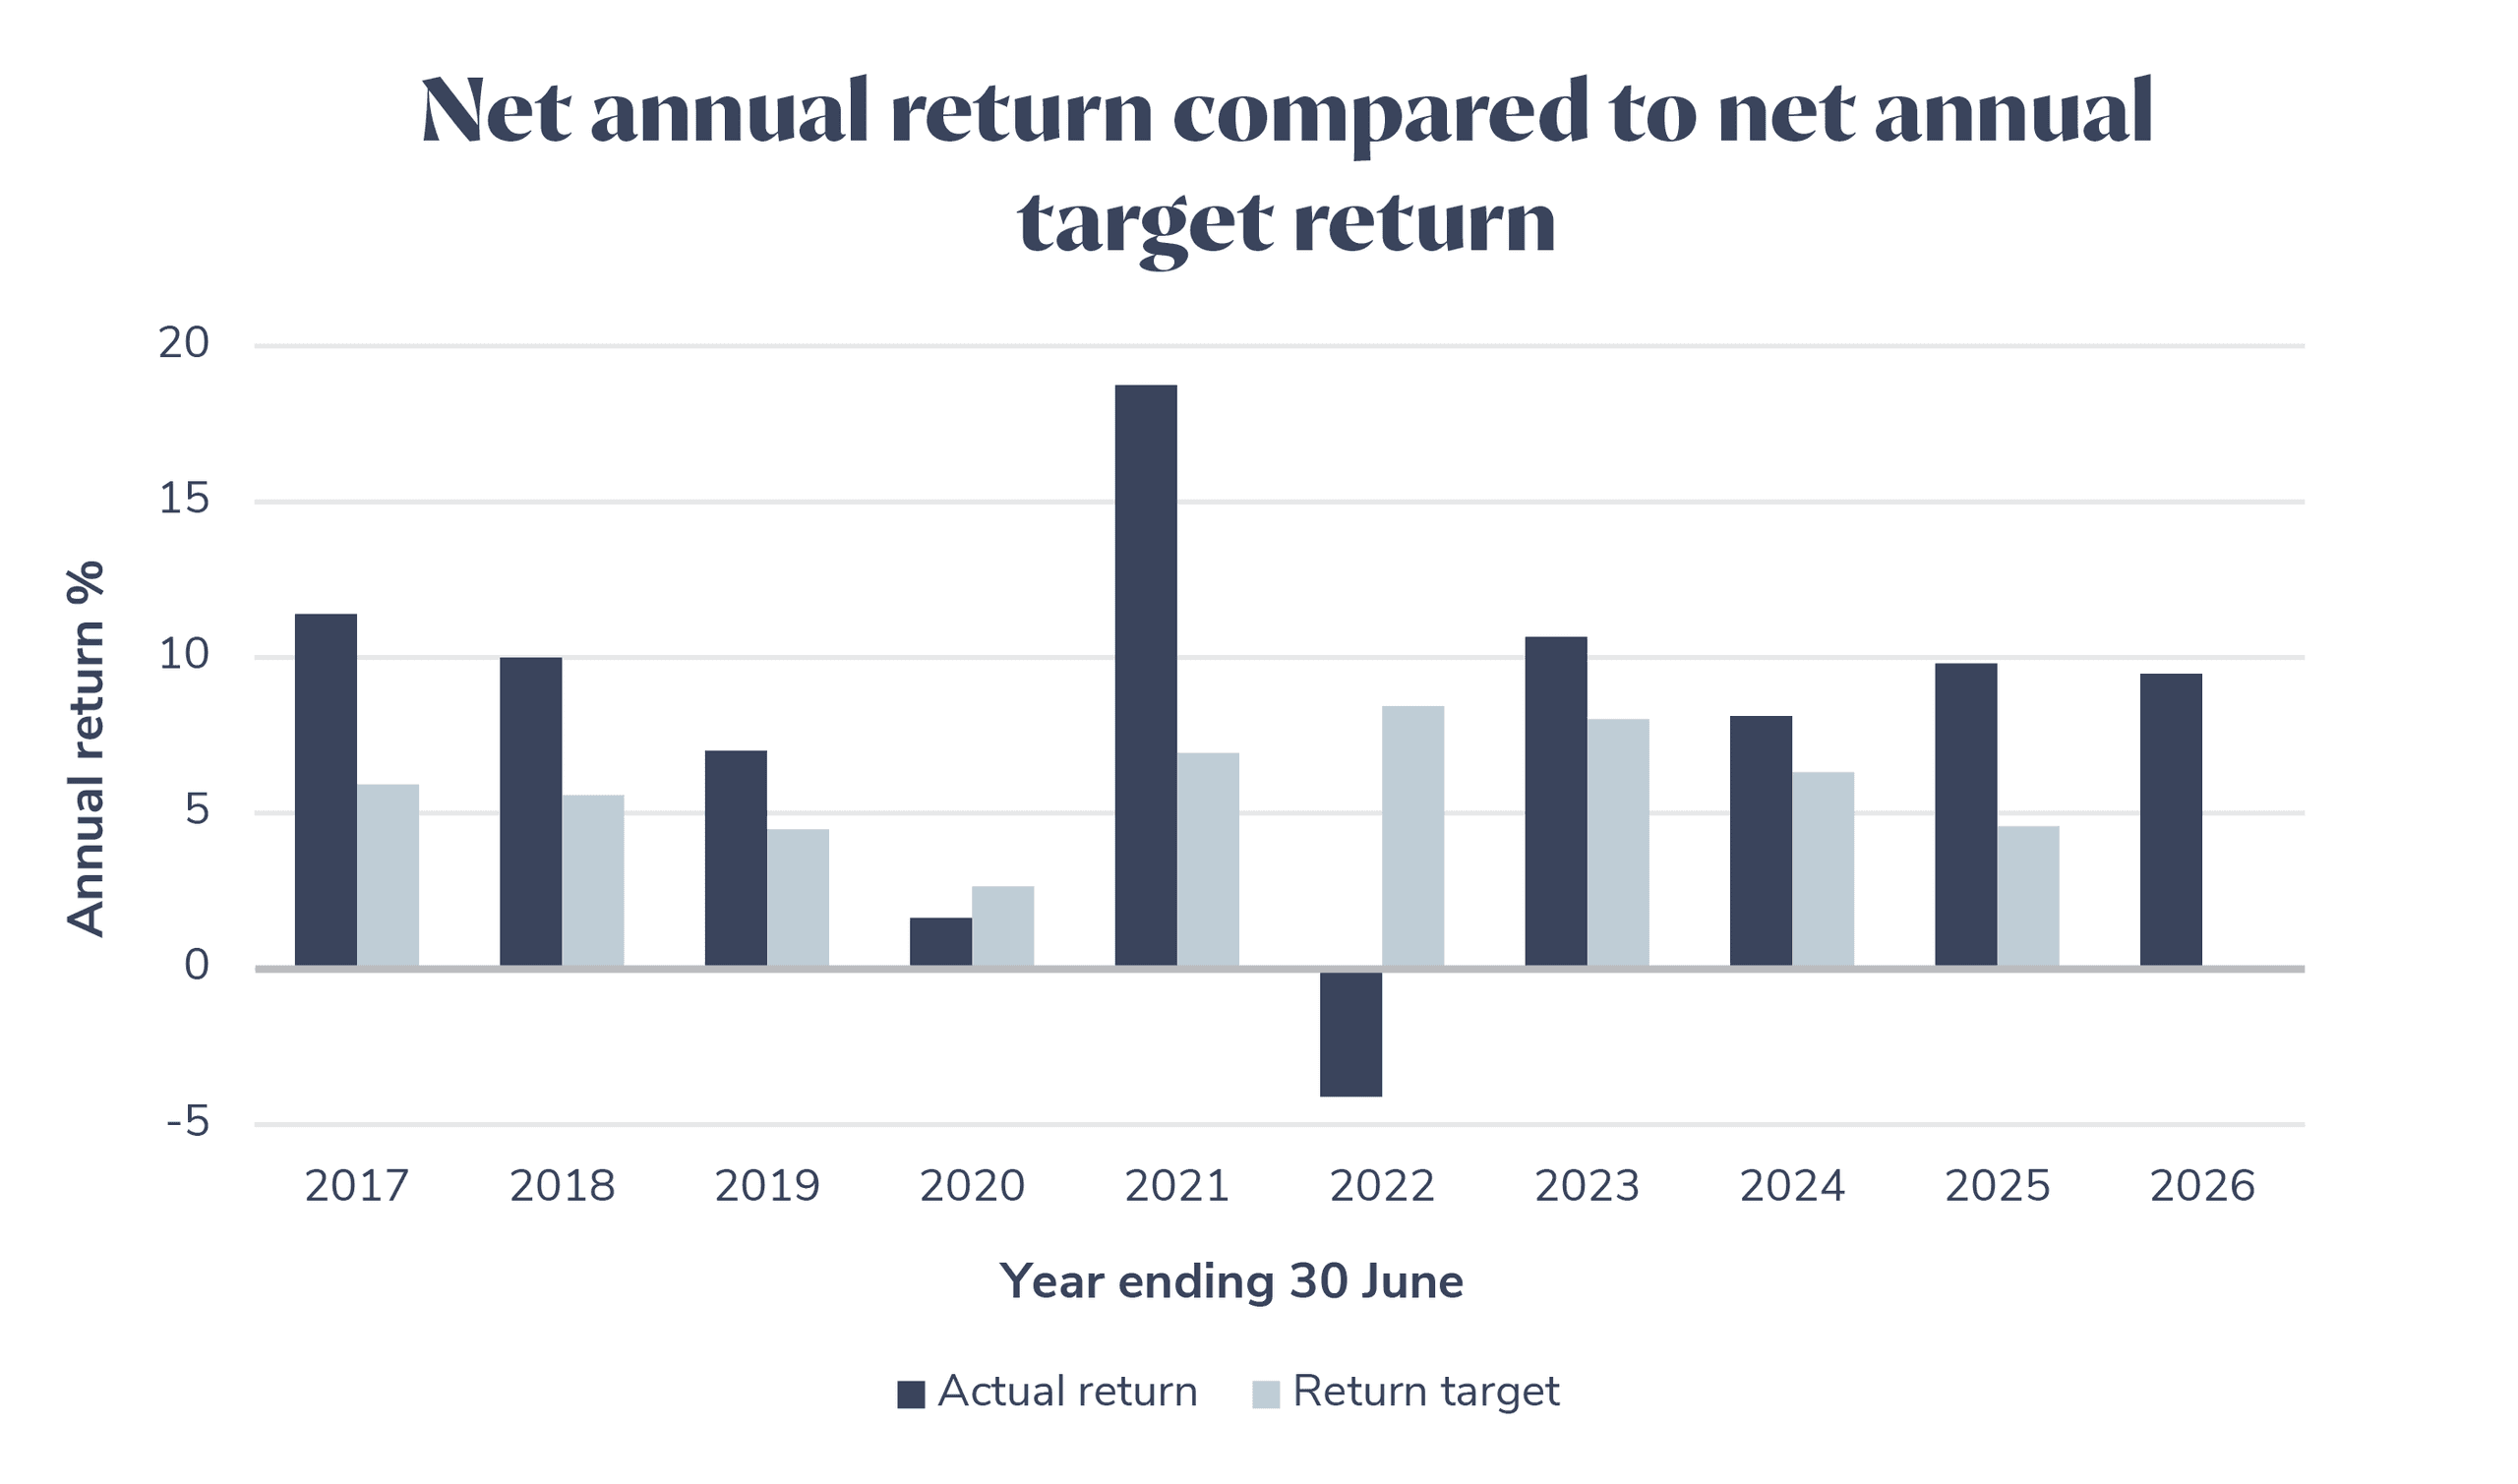
Return target | Return |
|---|---|
CPI (inflation) plus 3.0% per year (after fees and taxes) averaged over 10 years (1 July 2026 to 30 June 2036). | 10 year average return of 8.12% as at 30 June 2026. |
Future returns cannot be guaranteed. | |
Level of investment risk | Statement of fees and other costs |
|---|---|
High Negative returns are expected between four to six years out of every 20 years. The higher the return target, the more often you would expect a year of negative returns. | $311 per annum For a representative MySuper member with a $50,000 account balance. |
Future returns cannot be guaranteed. | |
* The 2026 annual return target and the 10 year moving average return target will be updated following the release of the June 2026 CPI data from the ABS.
* The 2026 annual return target and the 10 year moving average return target will be updated following the release of the June 2026 CPI data from the ABS.
Glossary of terms used in the dashboard
Return target
This represents the average annualised net return for Vision MySuper over the next 10 years (from 1 July 2026 to 30 June 2036). CPI refers to the Consumer Price Index which is an inflationary indicator that measures the change in the cost of a fixed basket of products and services as released by the Australian Bureau of Statistics (ABS).
The method for calculating the Return target is prescribed in MySuper legislation. It is intended to help people compare different MySuper funds. It is not necessarily the same as the Investment objective for the Balanced growth (MySuper) option (CPI + 3.0% per annum over rolling 15-year periods).
Future returns cannot be guaranteed.
Return
This represents the net return of a representative member. The net return of the representative member is the net investment return less investment fees, administration fees, costs and taxes. Investment returns are not guaranteed.
Past performance is not a reliable indicator of future returns.
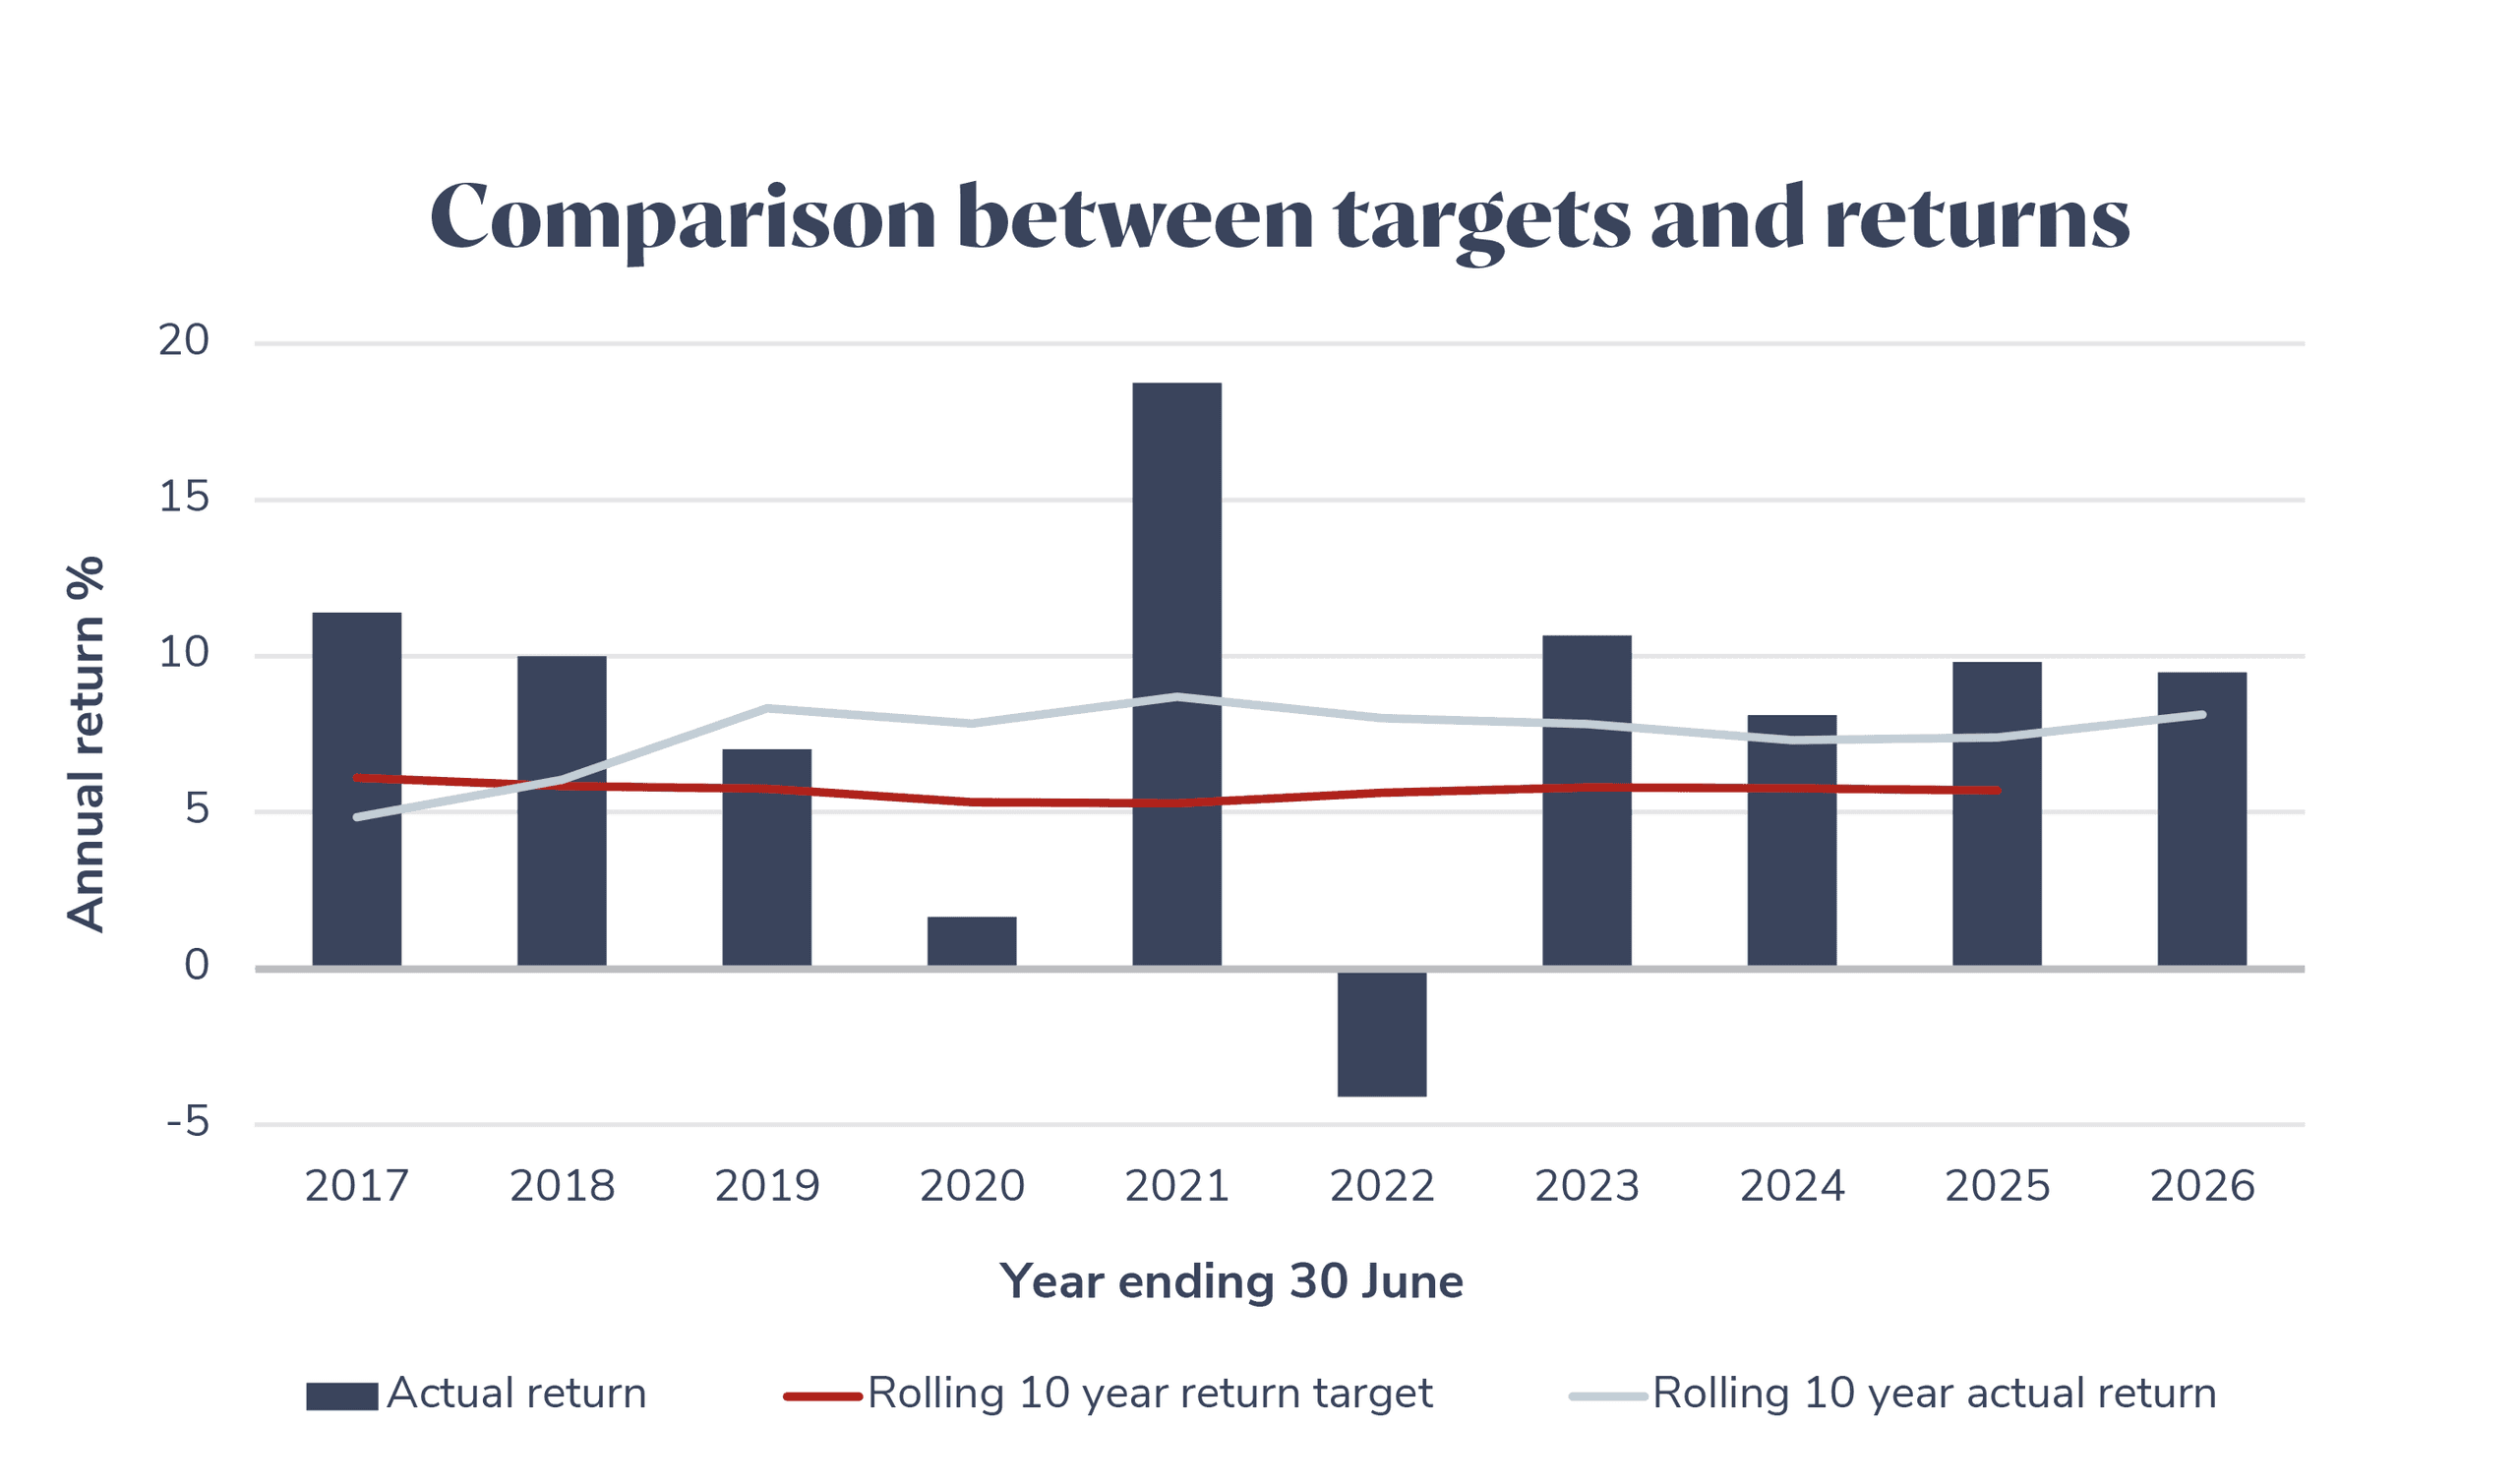
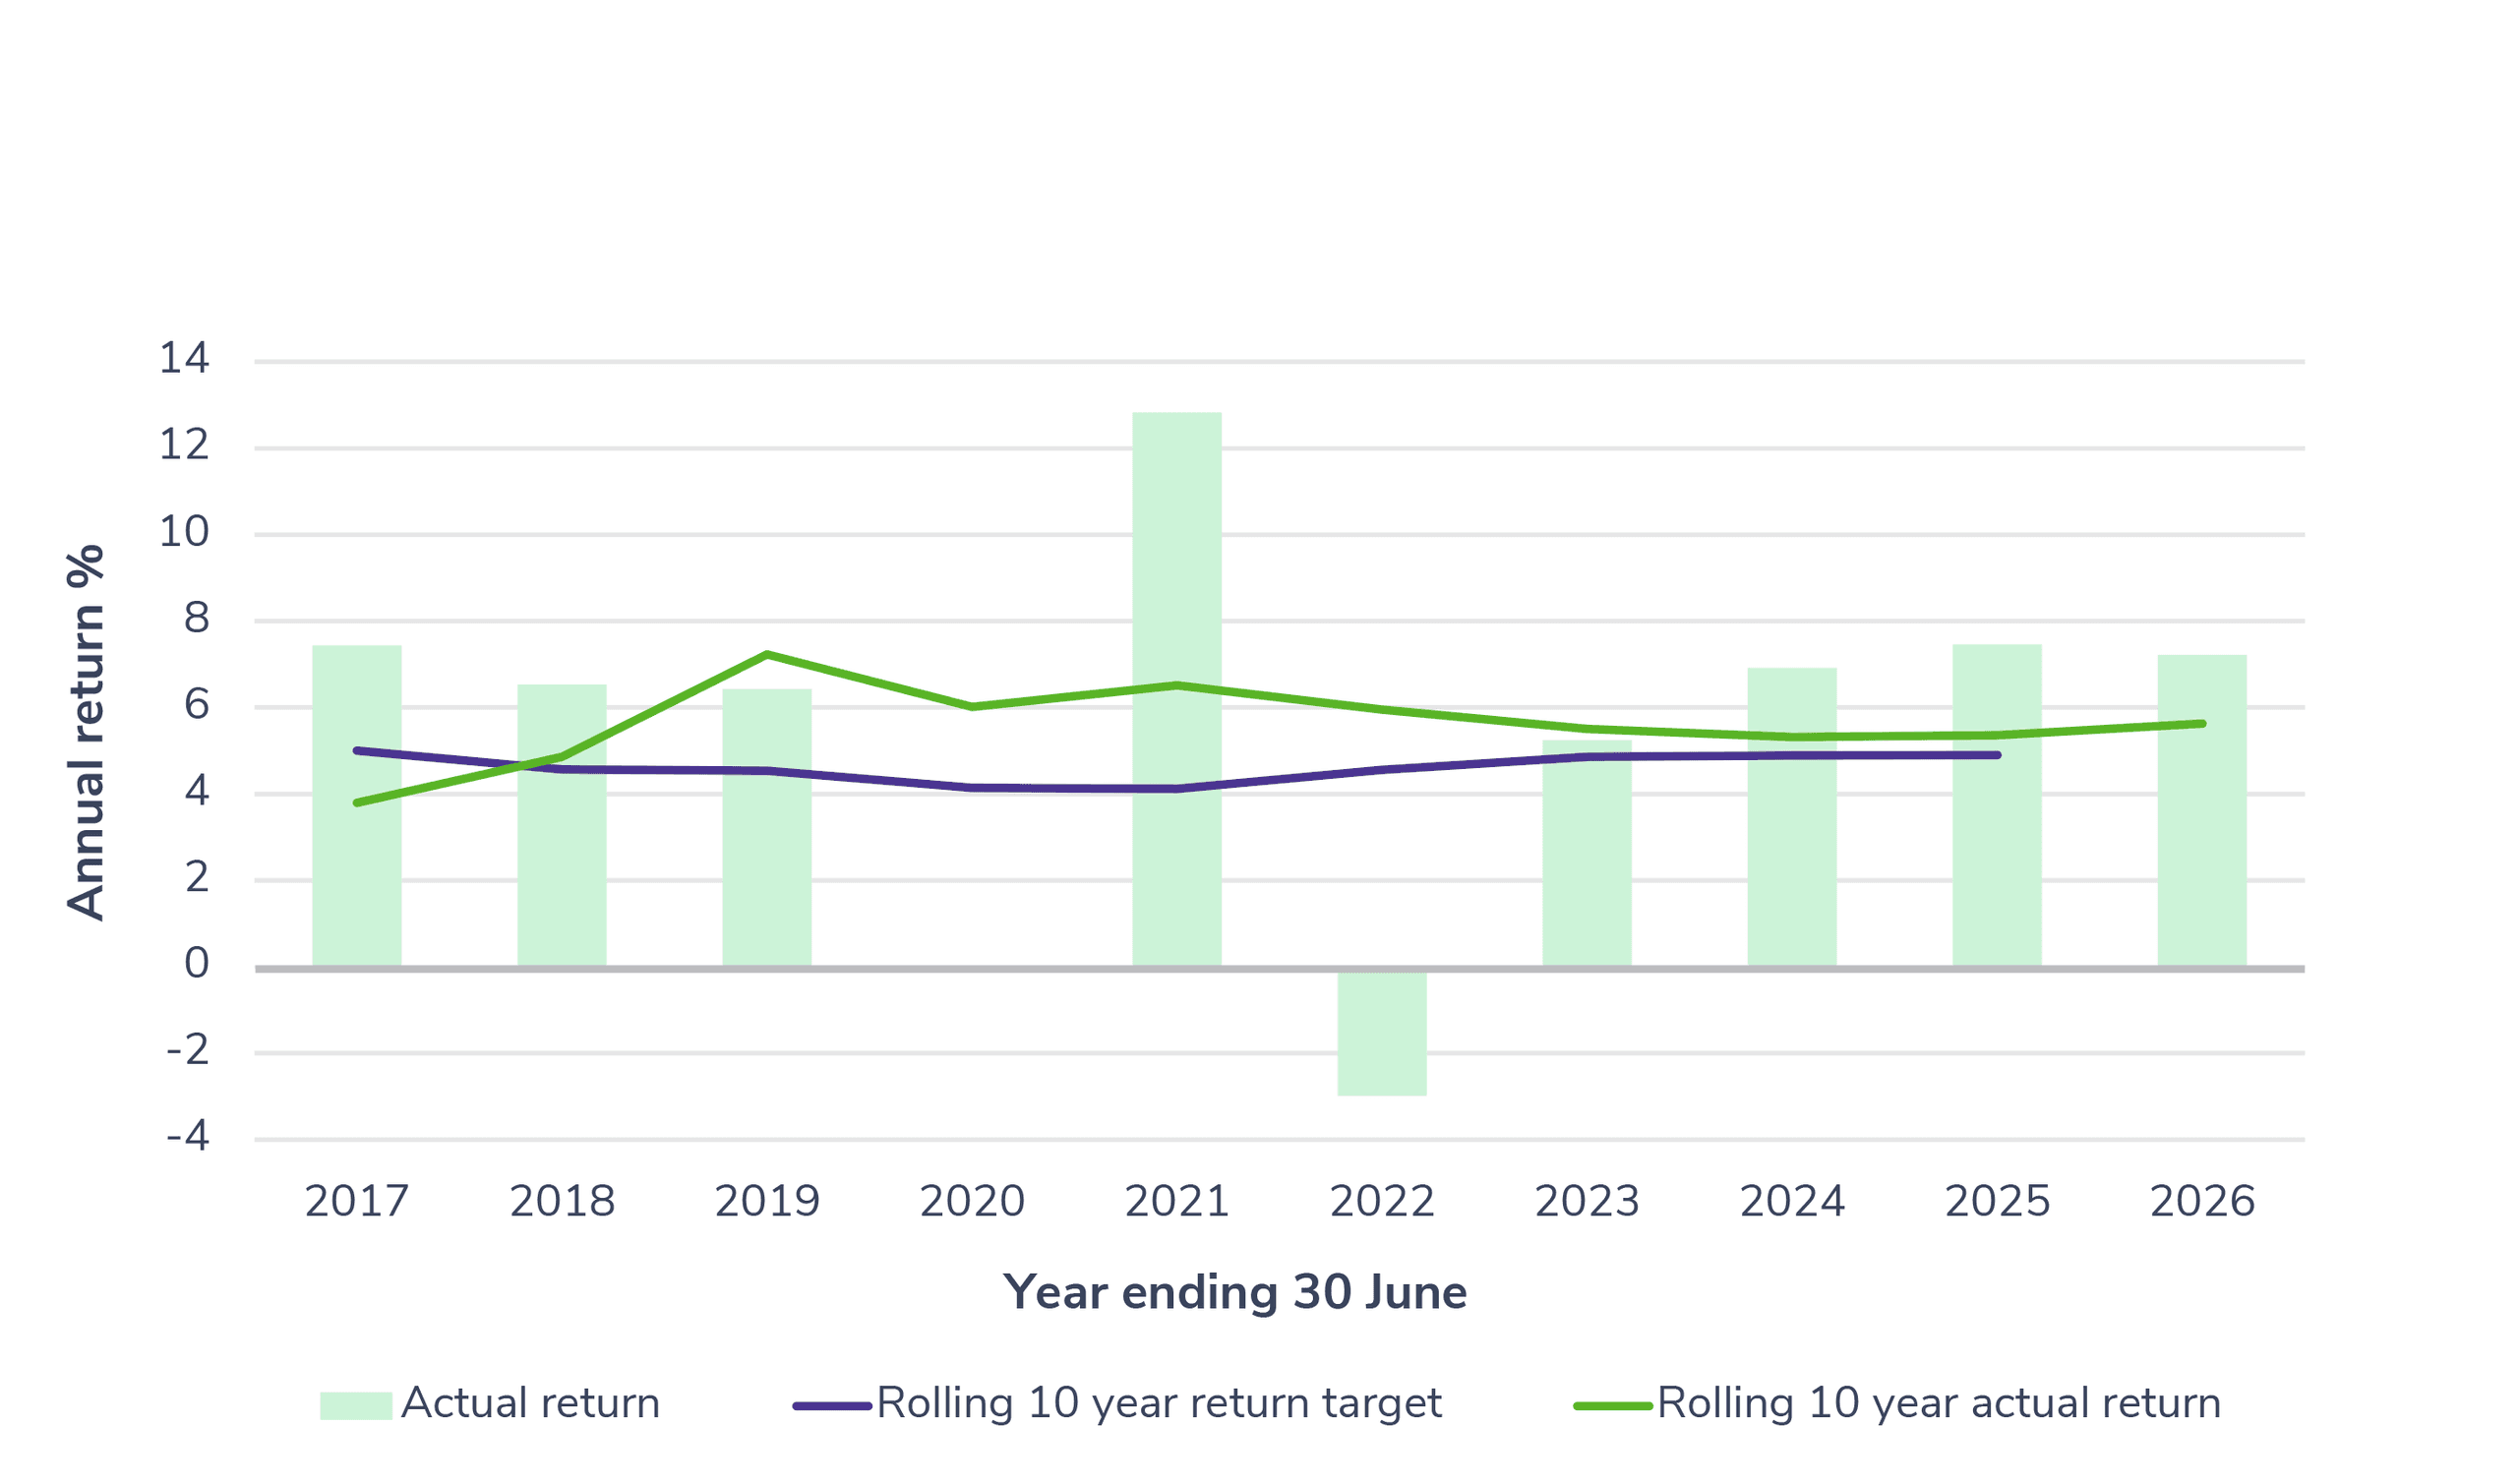
Comparison between return target and return
The first graph outlines the comparison between the historical return target and the historical returns for the Vision MySuper option for the previous 10 financial years as follows:
The dark blue columns represent the net annual return of a representative member for each year in the comparison period.
The red line represents the 10 year moving average return target.
The light blue line represents the 10 year moving average net return of a representative member.
Level of investment risk
This represents the estimated number of years in a 20 year period where negative net investment returns may occur. This is based on the Standard Risk Measure (SRM) Guidance Paper for Trustees and SRM Implementation Guidance for Trustees which has been issued by the Association of Superannuation Funds of Australia and the Financial Services Council to develop a consistent methodology for determining a standard measure of investment risk.
The ‘high’ rating means that there is likely to be four to six periods of negative annual net investment returns over a 20 year period. The SRM is based on industry guidance to allow members to compare investment options that are expected to deliver a similar number of negative annual returns over any 20 year period.
The SRM does not take into account all forms of investment risk such as:
The size of a negative return.
The potential for a positive return to be less than you may require to meet your objectives.
The impact of administration fees and taxes on the likelihood of a negative return.
You should still ensure that you are comfortable with the risks and potential losses associated with this investment option.
Statement of fees and other costs
This represents the dollar value of fees and other costs that will be deducted from a representative member’s account balance in the Vision MySuper during the current year.
Fees and costs for the current financial year include an estimate of the investment costs based on those costs for the year ended 30 June 2026. The investment costs for future years are not currently known and can be higher or lower. In the event that we increase our fees to cover any additional costs, we will notify you at least 30 days in advance and will update our disclosures on the website.
If you’re looking for more information to help you choose the right MySuper fund for you, ASIC’s MoneySmart website can help.
This MySuper Product Dashboard provides members with important information about the Active Super MySuper product - Active Super Saver Lifestage Product.
The MySuper product dashboard is based on a representative member with an account balance of $50,000 balance fully invested in each lifestage of the Active Super Saver Lifestage Product.
Vision Super and Active Super merged on 1 March 2025. The information included in this dashboard includes return history for the former Active Super fund (the predecessor fund, LGSS Pty Limited (ABN 68 078 003 497) (AFSL 383558), as Trustee for Local Government Super (ABN 28 901 371 321)(‘Active Super’)) as required by law, based on information provided by that fund. The returns of the Active Super Saver Lifestage product (as part of Vision Super) will depend on Vision Super’s investment outcomes (including fees and costs).
Accelerator - age up to 49
Comparison between return target and return
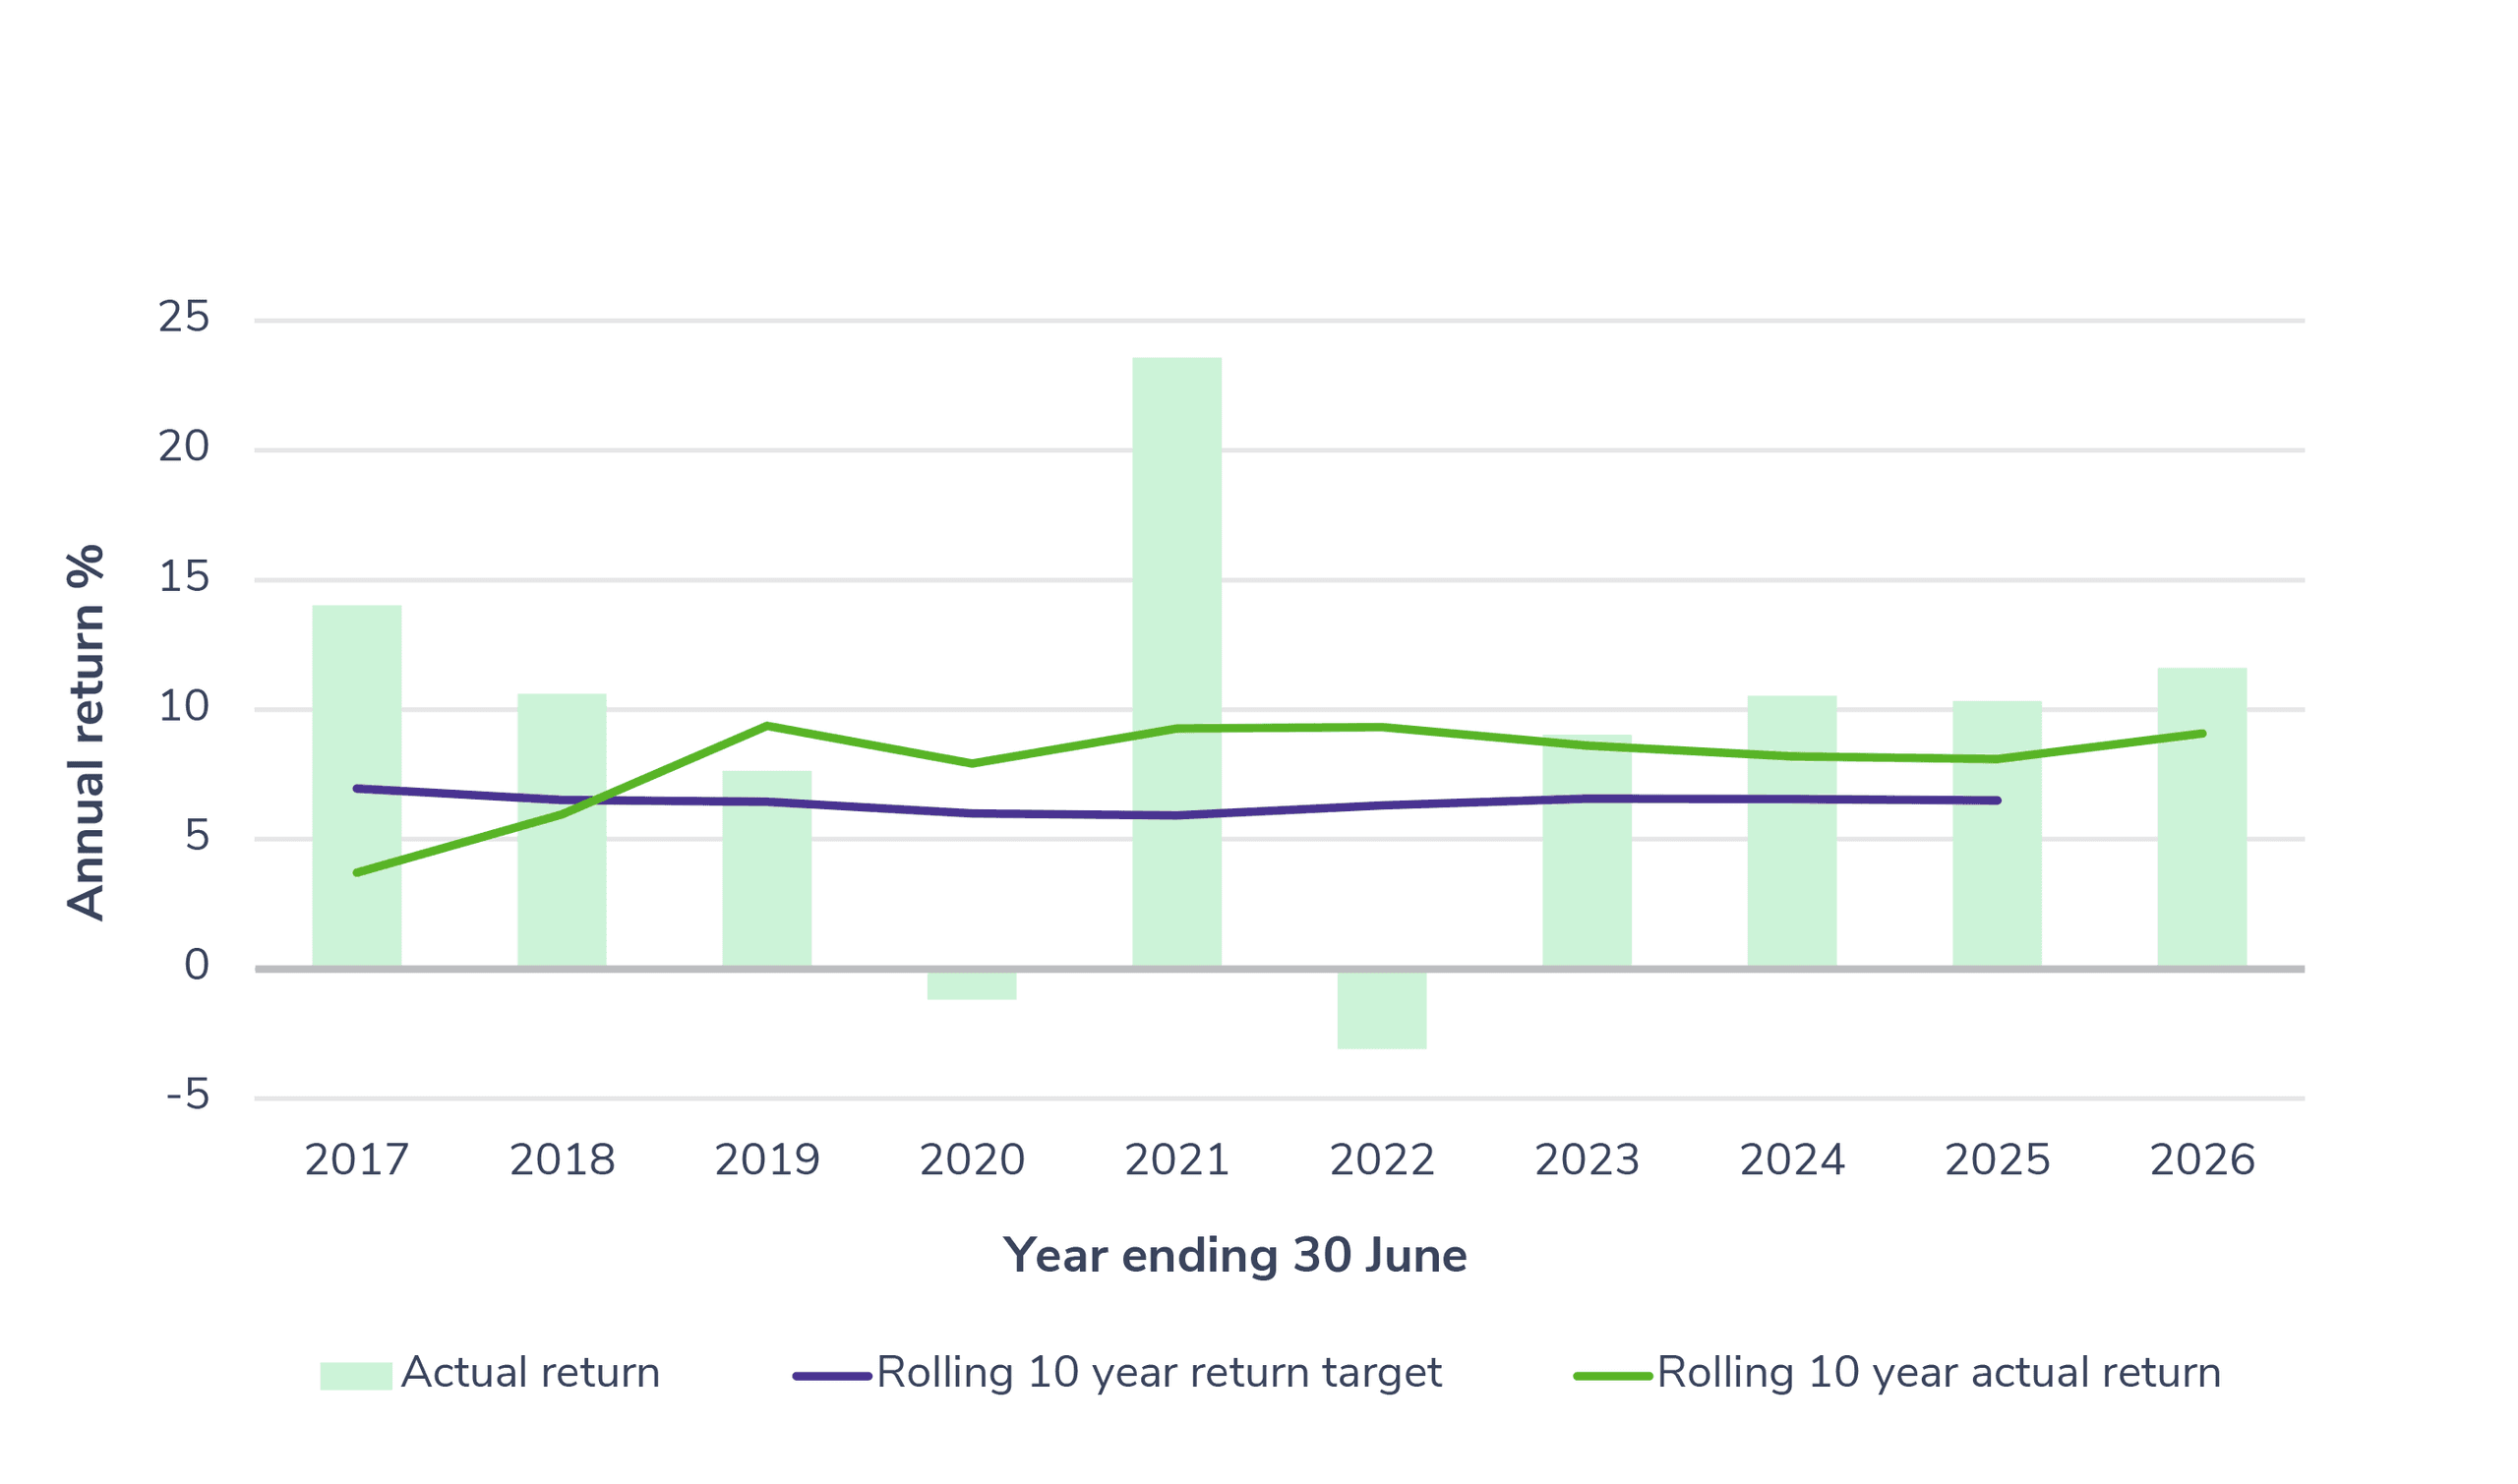
Return9.07%
| Return target3.5%+CPI |
Statement of fees and other costs$436 | Level of investment riskHigh |
Accumulator – age 50-54
Comparison between return target and return
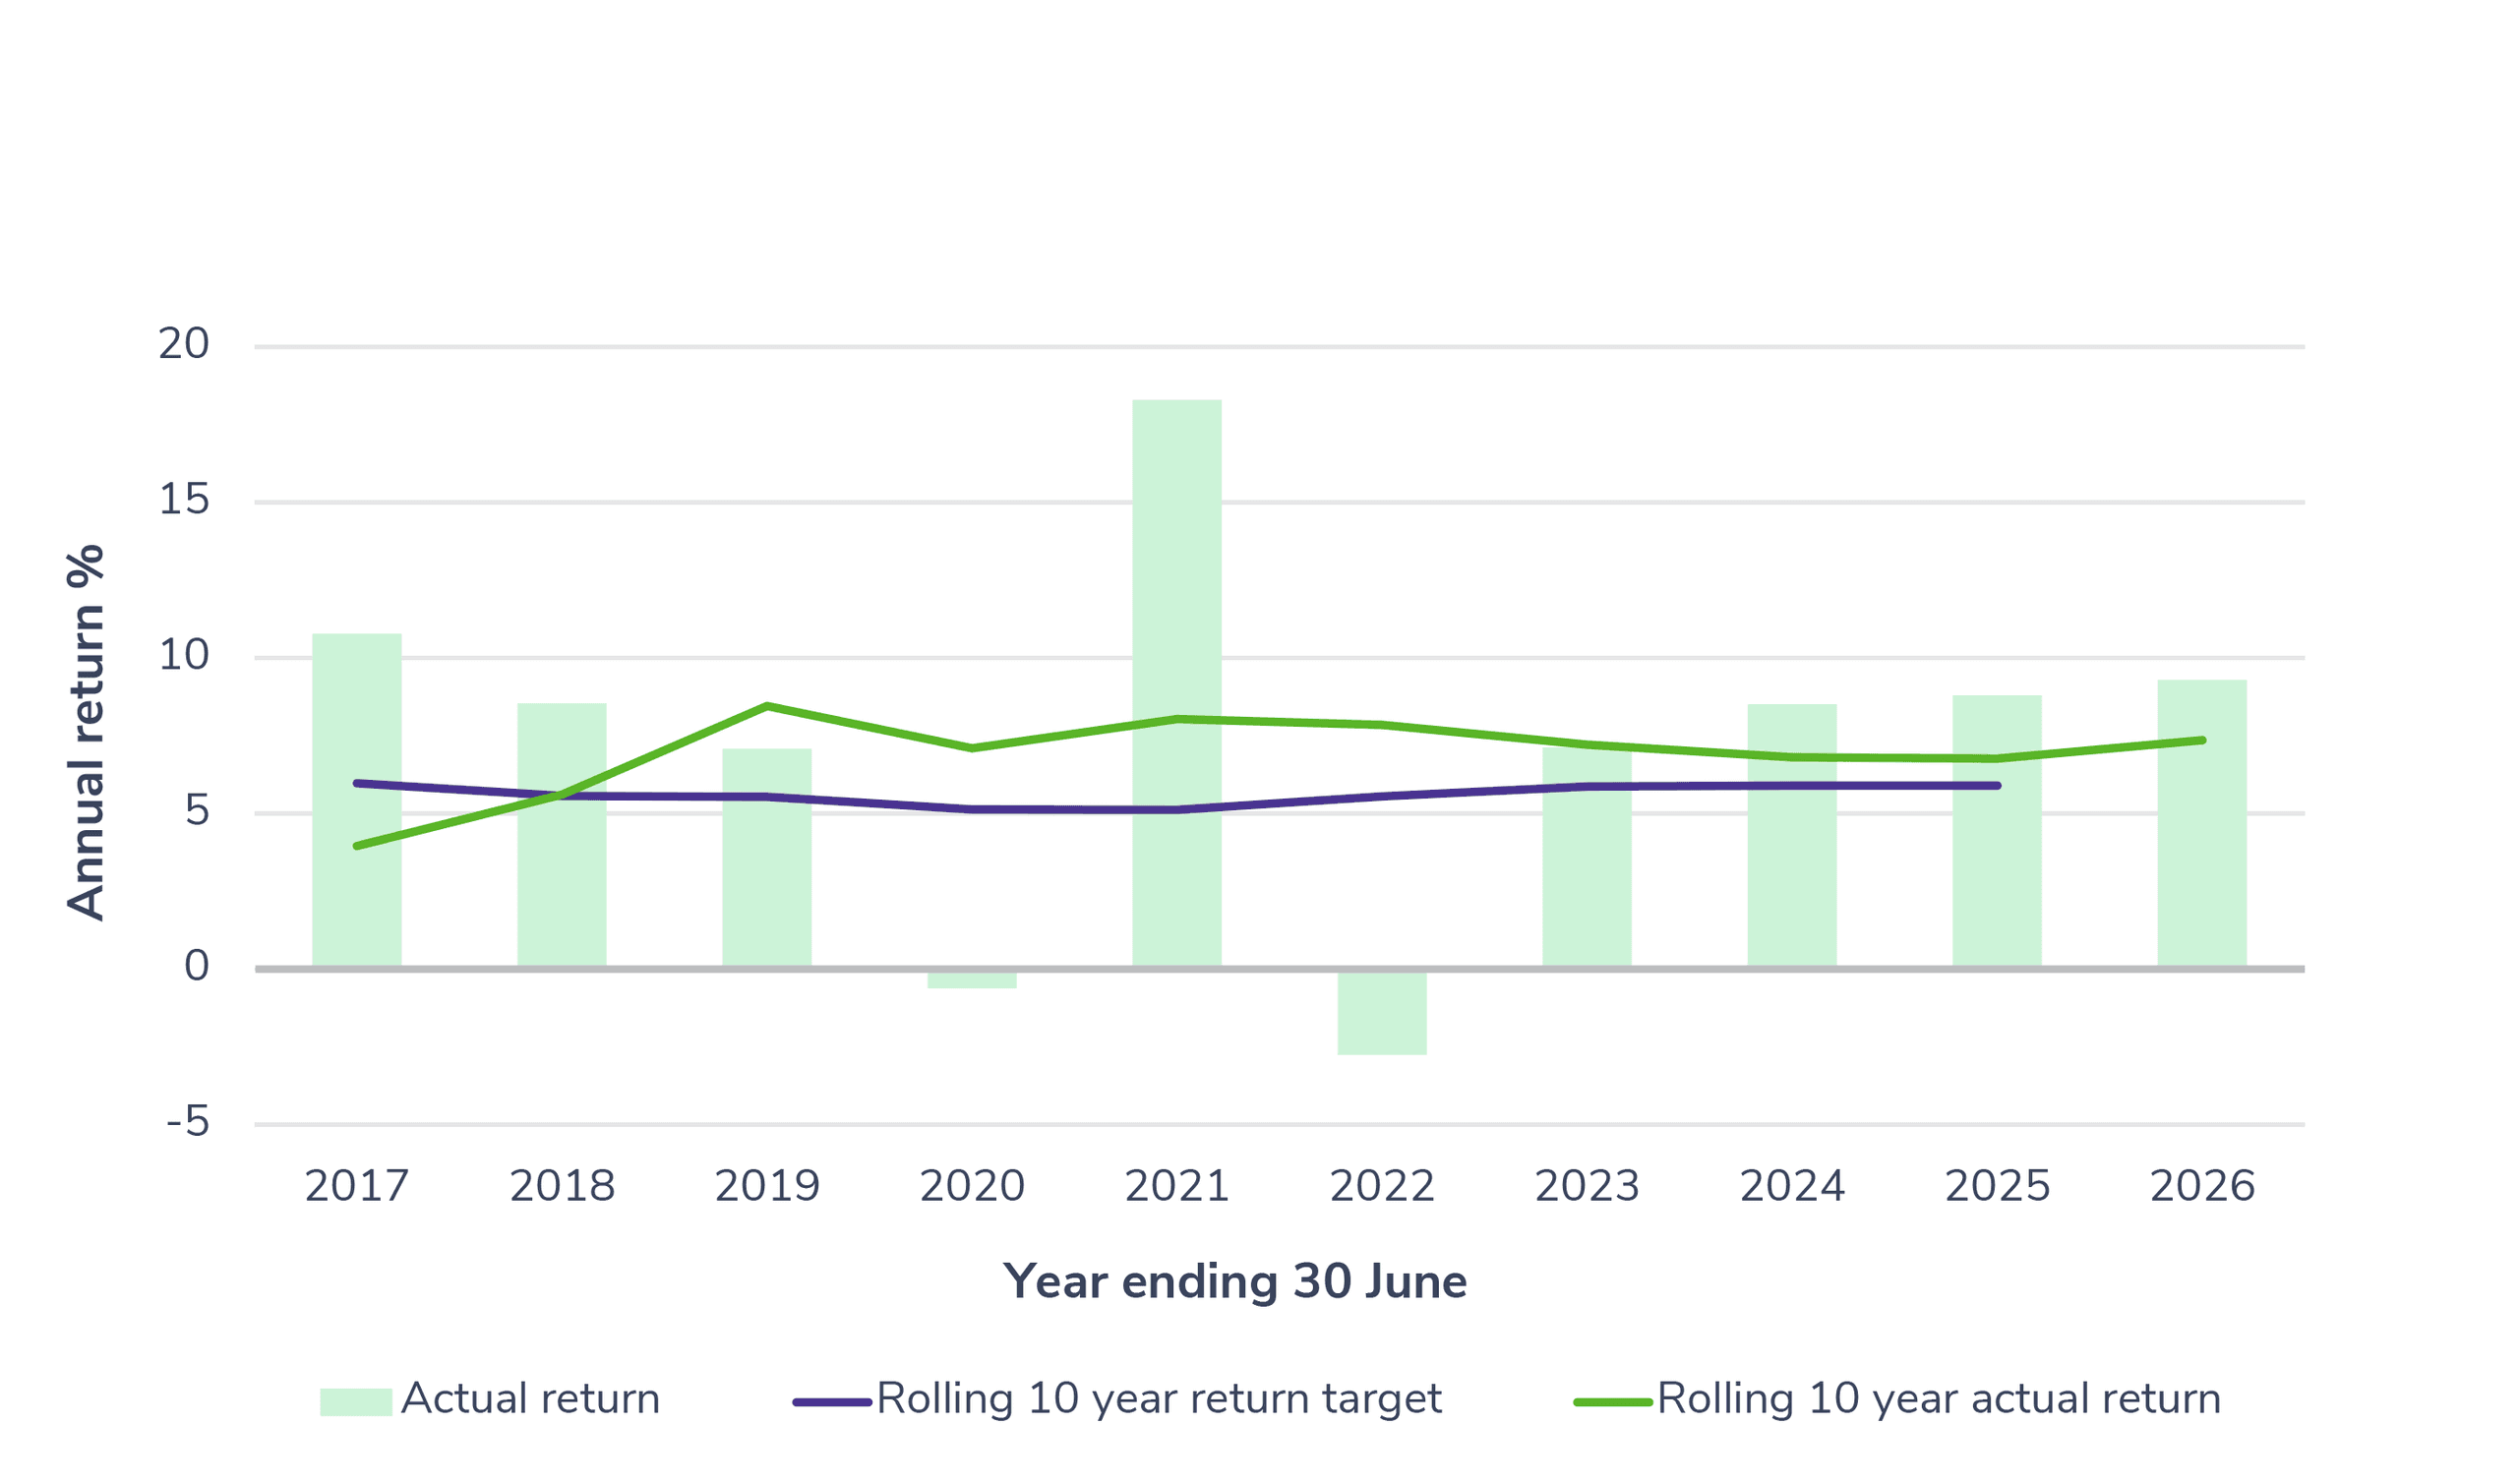
Return7.36% | Return target3.0%+CPI |
Statement of fees and other costs$416 | Level of investment riskHigh |
Appreciator – Age 55+
Comparison between return target and return
Return5.63% | Return target2.5%+CPI |
Statement of fees and other costs$396 | Level of investment riskMedium to High |
Glossary
Return
The return is an average net return over the 10 years to 30 June 2026. The return is net of all investment, administration fees, advice fees, costs and taxes for a representative member. It is important to remember that past performance is no indicator or guarantee of future performance, and the value of investments can rise or fall.
Future returns cannot be guaranteed.
Return target
The return target is expressed as a target level of return above inflation (as measured by the Consumer Price Index) over a ten-year period. The return target is the average of the expected annual returns for the ten-year period, based on long-run return assumptions, net of all investment, administration and advice fees, costs and taxes. The return target does not constitute a forecast or guarantee of future performance or future rate of return.
Level of investment risk
The level of investment risk is based on the Standard Risk Measure (SRM). For more information, please read the Risks of investing in super additional guide.
Statement of fees and other costs
The statement of fees and other costs shows the dollar value of investment, administration and advice fees and costs for a representative member. For further information on the underlying fees, please read the Fees and costs additional guide.
Comparison between return target and return
The columns in the graph show the one-year net return for each year to 30 June. The green line shows the 10-year moving average net return to 30 June of each year. The purple line shows the 10-year moving average target return to 30 June of each year.
This page was last updated: 16 July 2026